
TIPP Project
The Tensor Image Processing Platform (TIPP) is a software platform that seeks to become a unified platform in which researchers will create plugins which can combine various research techniques and improve the conservation of written code. It is also meant to provide a usable and understandable interface for researchers that have less experience with programming so that they too are able to use powerful plugins and analysis methods created by their co-researchers.
Advanced laboratory equipment
Raman measurements
Biological applications
Generic applications
- Precancer/cancer detection
- Raman investigation on viruses
- Microorganisms: Direct identification of clinically relevant microorganisms on solid culture media
- Agrofood: Rapid detection of foodborne microorganisms on food surface, Protein analysis in food systems, rapid analysis of sugars
- Pharmaceutical applications: pharmacokinetics
- Confocal microscopy
Tissue applications
- Raman measurements of plant tissue (in example cell walls)
- Mammalian tissue (flies brain tissue)
- Human tissue (skin, thyroid: cancer imaging)
- Ιdentification of unknown particles on a biological tissue
- Analysis of proteins, lipids, nucleic acids and sugars in tissues
Cells (fixed or live)
- In vivo discrimination between normal and pathological cells: carcinoma, melanoma, human thyroid, leukemia, prostate, blood, brain, skin, epithelial, lung, breast, bladder
- In vivo characterization of different types of human skin cells, lymphocytes, lung cancer cells, lymphoma cells etc.
- microorganisms such as bacterial cells and fungi
- Protein/lipid and sugar distribution in cells
Biofluids
- Lipid discrimination: Investigation the Atherosclerosis Process by Monitoring Lipid Deposits Including Cholesterol and Free Fatty Acids
- DNA/RNA:
- Raman analysis of Sperm Nuclear DNA Integrity
- methylation
- acetylation
- RNA detection in DNA samples
- Protein characterization in biological systems
- Nucleic acid assemblies analysis
Characterization techniques
Raman spectroscopy
- Description: Raman spectroscopy enables the characterization of chemical bonds vibration. It is a well-defined spectroscopic technique sensitive to the molecular vibrations of materials, since it provides fingerprint-like information regarding the molecular structure of the analyzed samples. It has been extensively used for the non-destructive and label-free cell characterization, particularly on the qualitative and quantitative estimation of amino acids, lipids, nucleic acids, and carbohydrates. This technique has promising applications for biological materials characterization, the early diagnosis, categorization and assessment of pathologies, and the putative drug efficacy on targeted diseases. It is important to note that Raman signal remains uninfluenced by water and contains information regarding concentration, chemical phase and crystallinity of the sample.
- Substrates
Raman grade Calcium Fluoride (CaF2) substrates (Crystran)
Raman Grade CaF2 offers many advantages:
► Wide transmission range from deep UV to mid IR
► Complete flexibility of laser between 130nm to 10µm
► One single Raman peak only at 321cm-1 specific to CaF2
► No other Raman peaks to confuse the results (does not interfere with the Raman signal)
► Minimal fluorescence
► Durable and insoluble
- microscopic slide – (75 x 25 x 1.0mm)
- Round and square Coverslips-200 or 500 μm thickness, 12 mm diameter covers the biological specimen in a microscope specimen. Used basically for liquid samples formation into flat layer of uniform thickness.
Stainless steel microscopic slide (Renishaw)
Provides improved signal for Raman spectroscopy of tissue and cells with minimum background
Raman hyperspectral imaging (mapping)
- Description: Raman spectroscopy coupled with optical microscopy achieves the acquisition of spatial and spectral information from a sample at the same time. Raman hyperspectral imaging allows the biomolecular characterization of the sample (different chemical content) within the field of view of the objective lens by adding distribution information on the spatial domain. Data are collected in the form of a three-dimensional hyperspectral datacube (x,y and λ) with x and y as spatial and λ as spectral dimensions.
- Characteristics: Hyperspectral data are acquired with the use of a XYZ scanner for mapping. Analysis is based on chemometrics and may be divided in three main parts: (i) preprocessing of the raw spectral data, aiming at extracting only the relevant information by limiting the effect of undesired phenomena, (ii) processing of preprocessed data based on univariate (peak height, area or ratio) or multivariate data analysis (for instance PCA, ICA, MCR-ALS or PLS) depending on the data complexity and (iii) post-processing of the image. Each chemometric tool has its own specificities and will be used depending on the available data and the desired results.
- Applications
- Tissue imaging and medical diagnosis
- Food safety inspection and control (Microbial growth localization)
- Inedible bodies in food (such as fish bones in fillets)
- Microbiology (single cell and microorganism imaging)
- Cell biology (Stem cell research, identification of cell cycle phase, monitoring of cell death, cellular responses to drugs)
SERS
- Surface-enhanced Raman spectroscopy or surface-enhanced Raman scattering (SERS) is a surface-sensitive technique that enhances Raman scattering by molecules adsorbed on rough metal surfaces or by nanostructures such as plasmonic-magnetic silica nanotubes. In this way we have scattering enhancement and therefore Raman signaling enhancement.
- Types of SERS
- Deposition of a liquid sample onto a nanostructured noble metal surface (Ag, Au)
- Dispersion of metal nanoparticles (Ag, Au, Cu) in the sample
- Nanoparticles for SERS
- AgNPs (Sigma-Aldrich Purchased Product Number: 730785)
- AuNPs; Silver, dispersion nanoparticles, 10 nm particle size (TEM), 0.02 mg/mL in aqueous buffer, contains sodium citrate as stabilizer (manufactured in laboratory)
- AgNPs by our lab with spermine (manufactured in laboratory)
- Potential Applications
- Intracellular imaging
- Biological mechanisms (such as “Insights into thrombosis mechanisms)
- Biosensing used for various cancers, Alzheimer’s disease, Parkinson’s disease, Diabetes Type 2 (SERS-based in vivo glucose sensor for diabetic patients)
- Live Single cells (such as lymphocytes)
- Food science (edible leaves examination)
- Nanotoxicology
- miRNA detection (from human blood, cancer cells etc.)
- DNA signaling enhancement from plants, mammalian, microorganisms, viruses, cell free and synthetic
- Single molecule (SMSERS)
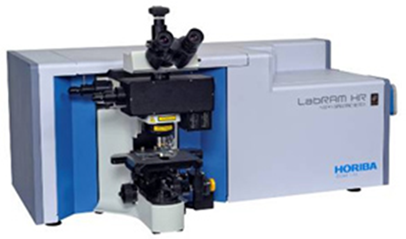
Horiba LabRAM HR Evolution Raman microspectrometer
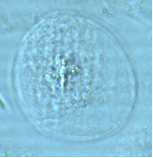
“HUH7” live cell
Instruments
- A “Horiba LabRAM HR Evolution” Raman microspectrometer (30 – 4000 cm-1) is with an open space Confocal microscope. It includes high throughput achromatic coupling optics optimized to work from UV to NIR with maximum efficiency, icluding also Open Electrode CCD air-cooled to -60°C. The Horiba LabRAM HR Evolution Raman microspectrometer is attached to two air-cooled solid state laser kits, at 532 nm (532 nm/100 mW), and at 785 nm (785 nm/ 100 mW).
- Olympus Objective lenses with the following characteristics; 10x (numerical aperture of 0.25), long distance 50x (NA=0.5), water immersion 60x (NA=1.2), 100x (NA=0.9), and 2 gratings (600 and 1800 grooves/mm, respectively) and another two lens (2.5x, 4x) custom made
- “Linkam PE120” thermoelectrically cooled stage
- x,y,z micro positioning stage
- Köhler Illumination (μlight transmission system based on LEDs)
.

Fourier-transform Infrared (FT-IR) Spectroscopy
- Complementary technique
- Infrared spectrum of high resolution data over a wide spectral range
- Absorption of light, depends on a change in dipol movement
- Quantitative and qualitative reflection
- Controlled sample exposition to extreme conditions, no fluorescence interference
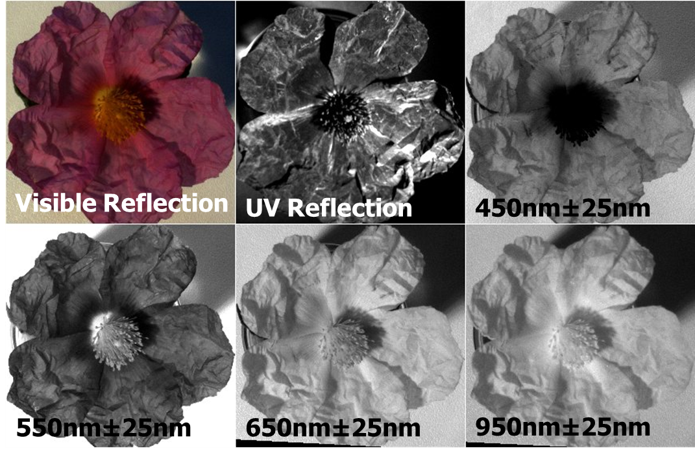
Spectral Imaging
- Quantitative detection and mapping of chemical characteristics
- Wide range of wavelength bands across the near ultraviolet to the infrared wavelengths of the electromagnetic spectrum
- Allowing the study of materials, their deterioration
- Spectral information at selected areas from 350 nm to 1200 nm.
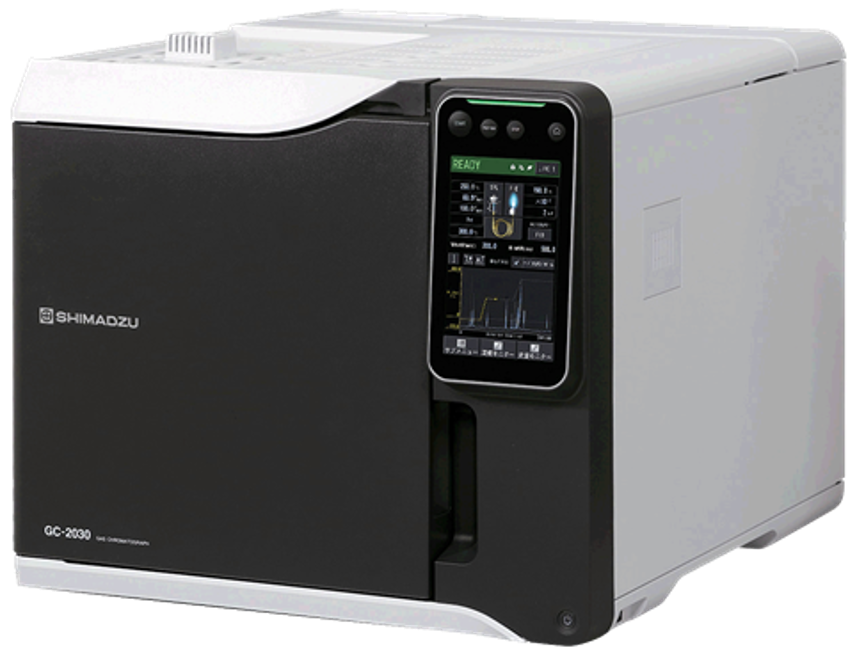
Gas chromatography
- Can analyze compounds that are volatile or can be vaporized at higher temperatures without decomposition.
- Analysis of inorganic gases and light hydrocarbons at ppm-level concentrations.electromagnetic spectrum
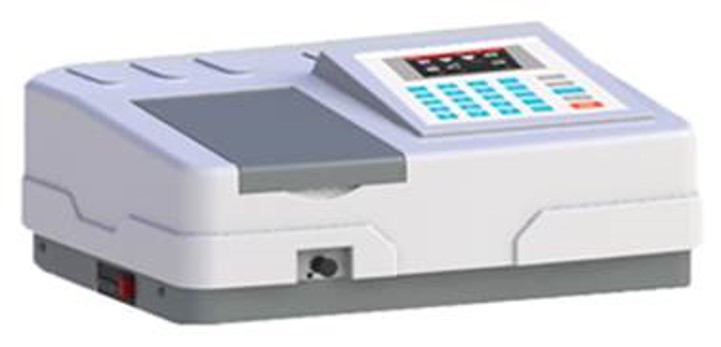
UV-VIS Spectroscopy
With this technique we can achieve :
- Charcterization of solid or liquid samples in absorption, transmission, or reflection mode, covering a spectral range of 190-1100nm
- Flexible approach, connects to light sources, cuvettes and other accessories and covers the 220-800 nm range